GlobalWarming & ClimateChange News Desk – A day-by-day glacier model projects 5% to 10% more ice loss by 2100 than monthly models, adding up to 1.3 inches of sea level rise Nature Communications Study Co-authors include Matthias Huss of ETH Zurich and the University of Fribourg, along with Harry Zekollari of the Vrije Universiteit Brussel.

A hot week in the mountains strips the snow off a glacier, and the dark ice underneath soaks up the sun for the rest of the summer. Most of the computer models that forecast the world’s glaciers don’t see that week. They run on monthly averages, and a few scorching days blur into the cooler ones around them.
A team at ETH Zurich and the Vrije Universiteit Brussel rebuilt one of those models to run day by day. Across 12,571 glaciers holding 94% of the world’s glacier ice, the daily version projects 5% to 10% more ice loss by 2100 than the monthly model. That is 0.8 to 1.3 inches (20 to 33 millimeters) more sea level rise.
“Glaciers don’t respond to monthly averages, but to the weather they experience every single day,” said Lander Van Tricht, the lead author, who works at ETH Zurich, the Swiss research institute WSL, and the Vrije Universiteit Brussel.
“A heatwave lasting only a few days can cause enormous amounts of ice to melt.”
Daily weather exposes missed glacier melt
The model, called GloGEM, starts from a glacier’s shape and feeds it temperature and precipitation. From those it works out how much snow falls, how much ice melts, and how the glacier shrinks.
The standard version takes monthly numbers. The new version takes each day from 1980 to 2024, then daily output from five climate models through 2100 under three emissions paths.
Two things change when the model sees days instead of months. A run of warm days can strip the snow cover and expose darker ice that melts faster. The monthly model can only make that switch once a month. And whether a storm falls as rain or snow depends on the temperature that day, not the month’s average.
The daily runs cost about ten times the computing time.
Extreme melt years test the new model
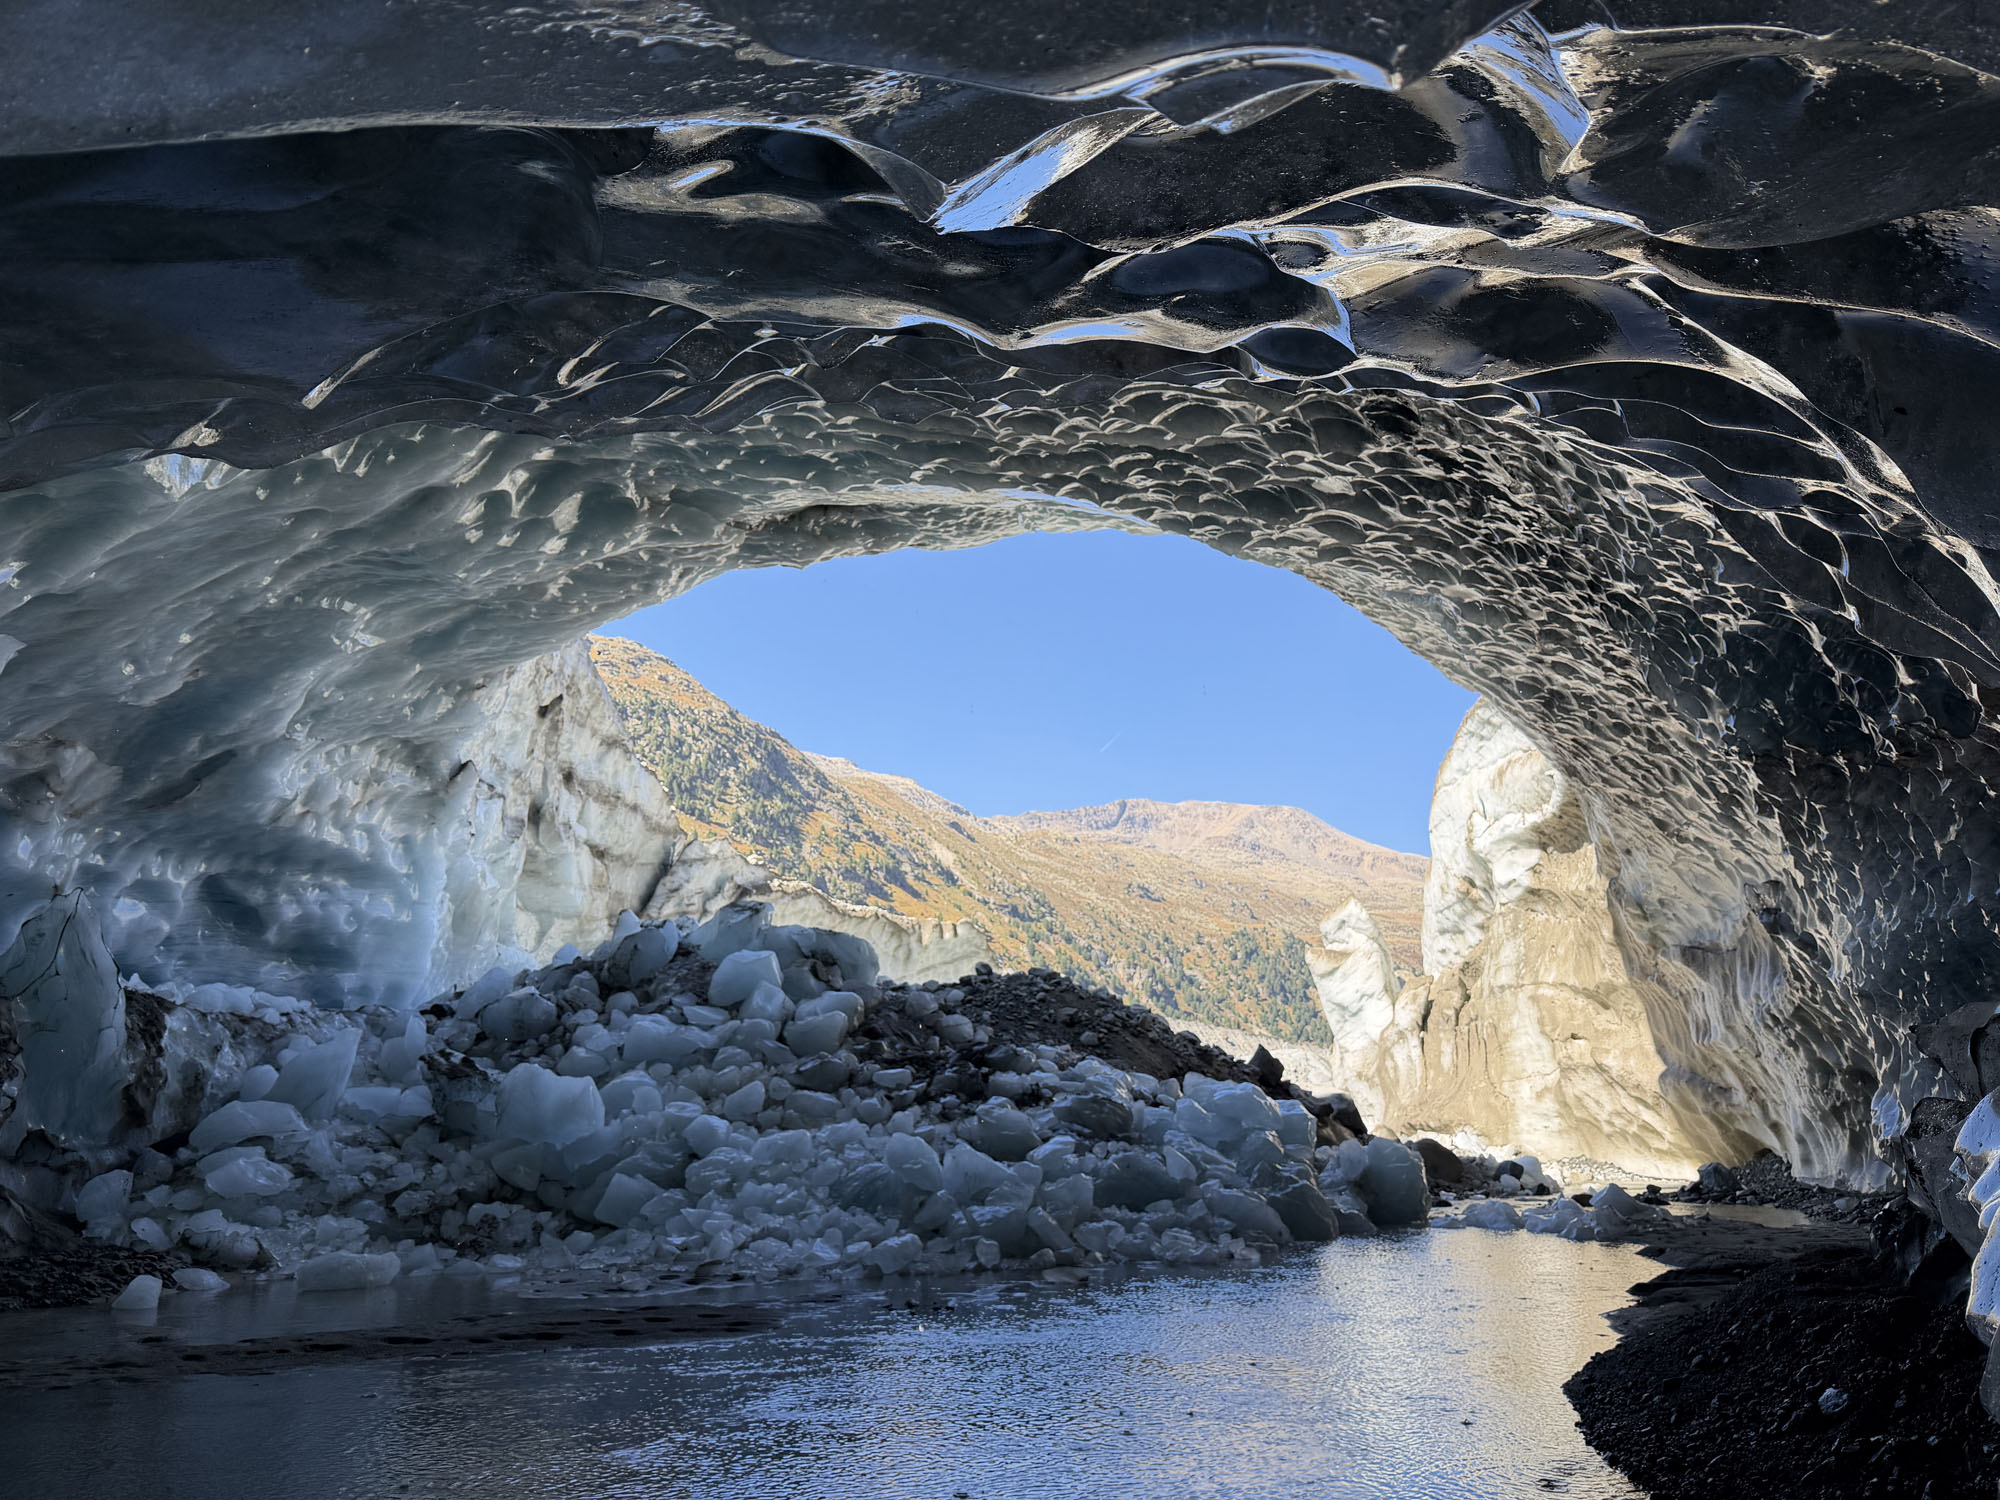
Against 4,037 measurements from glaciers in the field, the daily model did only slightly better than the monthly one in an ordinary year. In extreme years, like the recent ones in the Alps, western North America, Svalbard, and Central Asia, the gap opened.
In the European Alps’ record melt of 2022, the daily model’s estimate of the loss ran about 1 foot (0.31 meters) of water deeper than the monthly model’s. That was much closer to what was measured. In Svalbard’s 2024 melt, the difference reached about 3 feet (0.98 meters).
In an interview with Earth.com, Van Tricht said that better fit is what gives the team confidence in the rest. The closer match to field measurements, he said, shows that counting daily weather gives a more realistic picture of melt. Over the coming decades, that picture generally means faster loss.
Arctic glaciers face the biggest losses
The daily model’s biggest effect lands in the Arctic. In Svalbard and the Russian Arctic, low, flat ice caps with a narrow range of elevations, it projects up to 25% more ice loss by 2100 than the monthly model. The authors call those numbers upper-end estimates because the regions are sensitive to how the model is tuned.
“In monthly climate data, a few exceptionally warm days can be completely masked by the colder conditions during the rest of the month,” Van Tricht told Earth.com. “As a result, the monthly model misses important melting episodes, whereas the daily model captures them.”
Elsewhere the differences are smaller. In mid-latitude ranges like the Alps and the Caucasus, the daily model projects 1% to 4% more loss by 2050. Then the two models converge, because both have most of the ice gone by 2100. In Alaska, Scandinavia, and the Southern Andes, where ice persists, the daily model ends the century 2% to 5% lower.
Those are modest gaps, and they all point the same way. Iceland is the one place the daily model projects less loss, about 4%. Its heavy precipitation tends to arrive on warm days, so a daily model classifies more of it as rain. The monthly model, Van Tricht said, overestimates the snowfall and so overestimates how much the glaciers gain.
Glacier meltwater could arrive earlier
Because the daily model tracks each day’s melt, it can say when the water comes down. In Western Canada and the United States, on the two higher emissions paths, it projects the runoff peak arriving about 46 days earlier by 2100 than in 2001 to 2020. The monthly model misplaces that shift by about 15 days.
It also catches the swings. In the Alps’ 2022 melt year, the daily model’s runoff was 8% higher than the monthly model’s, and in the cool year of 2014 it was 12% lower. Those are the years that matter to the river basinsbelow. Glaciers supply fresh water to nearly 10% of the world’s population.
Van Tricht said the daily model lets the team ask how much meltwater a glacier releases during a single heatwave, which the monthly version could not do. Knowing when that water arrives, he said, matters most during droughts and extreme heat.
Extra glacier loss raises sea levels
Glaciers outside the ice sheets lost about 300 billion tons (273 billion metric tons) of ice a year between 2000 and 2023. That raised the sea by 0.7 inches (18.1 millimeters), roughly a fifth to a quarter of the total rise, with the ice sheets counted separately.
The daily model projects a further 26% of the 2025 ice volume gone by 2100 on a low-emissions path and 47% on a high one, with wide uncertainty either way. The emissions path matters more than the model’s time step, but the time step matters too.
Over the century that adds up to 3.4 to 6.2 inches (86 to 157 millimeters) of sea level rise from glaciers alone. The extra inch or so over the monthly model sits within the spread of the five climate models, and the gap between the two versions was still widening in 2100.
Van Tricht put a human scale on it. By the estimates he cited, each additional millimeter of sea level rise could expose another 200,000 to 300,000 people to annual flooding. A few centimeters, he said, are far from negligible for coastal communities already facing rising flood risk.
Model limitations leave some uncertainty
The model skips every glacier smaller than about 2 square miles (5 square kilometers), which is most glaciers by number but only 6% of the ice. The overall improvement in matching ordinary years is modest, and the polar numbers depend heavily on calibration, so the authors trust the direction more than the size there.
Daily runs are also expensive, and the team expects monthly models to stay standard for large ensembles. One fix they tested in Iceland, giving the monthly model a daily snow-or-rain rule, moved its result most of the way to the daily one. Satellite maps of daily snow cover are the next check, since a daily model can be compared against them directly.
Asked which region worries him most after this year’s melt, Van Tricht named the Alps and Western Canada, then set them aside. Their glaciers are already projected to lose most of their ice, he said, so there isn’t much left for the two models to disagree about. The places he watches are Svalbard and the Russian Arctic, which still hold a great deal of ice that a few warm days can reach.
At Sterling Publishing & Media Service Agency, we prioritise transparency and accountability in all our operations. We wish to clarify that we are not responsible for any external content, hyperlinks, or costs associated with our services. Nevertheless, we remain committed to delivering outstanding services and greatly value your continued support. Thank you for your trust in us.

